Risk Assessment Section
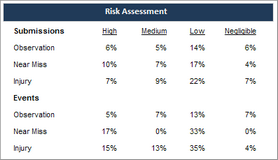
The Risk Assessment section provides information about the risk of the issues reported, showing how many submissions and events fall in the High, Medium, Low, or Negligible [Risk] categories. The IMS evaluates the overall risk of a submission or event based on the supervisor’s evaluation of the severity of the current incident and the probability that a similar incident will occur again in the future.
These metrics help you evaluate whether your employees take ownership over the safety of their workplace.
- These metrics do not depend on the value in the Date Range parameter on the report. This section always displays statistics current as of the date when the report is run.
- Any submissions or events that haven’t been assessed regarding risk (that is, in which the Severity section has not been evaluated) are not included in these calculations.
Details
| Metric | Type | Description | Calculation Method | Drill-Down |
|---|---|---|---|---|
|
Submissions: Observations |
Leading indicator |
Most observations should fall in the low or negligible risk categories. If employees are reporting a lot of observations with a high or medium risk, then they are waiting too long to report issues or they are focusing only on major problems and not paying attention to the smaller issues that could lead to incidents. Train employees to report smaller issues in order to prevent high-risk problems and incidents. |
Percentage of submissions of the Observation type that had a High, Medium, or Low risk assessment. The Negligible column displays the percentage of submissions of the Observation type with very low risk. |
No |
|
Submissions: Near Miss |
Leading indicator |
Most near misses should fall in the medium or high risk categories if employees are evaluating risk accurately. |
Percentage of submissions of the Near Miss type that had a High, Medium, or Low risk assessment. The Negligible column displays the percentage of submissions of the Near Miss type with very low risk. |
No |
|
Submissions: Injury |
Lagging indicator |
Injuries should fall in the high risk categories if employees are evaluating risk accurately. |
Percentage of submissions of the With Loss type that had a High, Medium, or Low risk assessment. The Negligible column displays the percentage of submissions of the With Loss type with very low risk. |
No |
|
Events: Observations |
Lagging indicator |
Most events that are related to observations should fall in the low or negligible risk categories. Train employees to report smaller issues in order to prevent high-risk problems and incidents. |
Percentage of events of the Observation type that had a High, Medium, or Low risk assessment. The Negligible column displays the percentage of events of the Observation type with very low risk. |
No |
|
Events: Near Miss |
Lagging indicator |
Most near miss events should fall in the medium or high risk categories if employees are evaluating risk accurately. |
Percentage of events of the Near Miss type that had a High, Medium, or Low risk assessment. The Negligible column displays the percentage of events of the Near Miss type with very low risk. |
No |
|
Events: Injury |
Lagging indicator |
Injury events should fall in the high risk categories if employees are evaluating risk accurately. |
Percentage of events of the With Loss type that had a High, Medium, or Low risk assessment. The Negligible column displays the percentage of events of the With Loss type with very low risk. |
No |