Activity Metrics Section
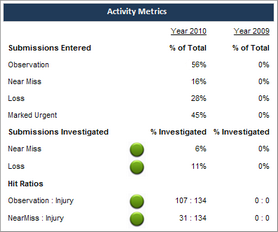
The Activity Metrics section displays statistics about all the submissions your employees have entered, such as what kind of issues they’ve noticed – whether they are general observations or near misses, for example – and how many of the more significant submissions have been investigated.
Drill-Down Details
- Click the Activity Metrics heading to open a drill-down report that displays the trend of each metric for the last 12 months.
- Click some of the metrics to see drill-down reports that list all the records contributing to these totals. Refer to the Drill-Down column in the table below to see the metrics that allow you to drill down to more details.
| Metric | Type | Description | Calculation Method | Drill-Down |
|---|---|---|---|---|
|
Submissions Entered: Observation |
Leading indicator | Most submissions should be observations and near misses. If employees are reporting a lot of losses instead of observations and near misses, then they are waiting too long to report issues or they are focusing only on major problems and not paying attention to the smaller issues that could lead to incidents. Train employees to report smaller issues in order to prevent near incidents. | Percentage of submissions that are of the Observation type. | Yes |
|
Submissions Entered: Near Miss |
Leading indicator | Most submissions should be observations and near misses. If employees are reporting a lot of losses instead of observations and near misses, then they are waiting too long to report issues or they are focusing only on major problems and not paying attention to the smaller issues that could lead to incidents. Train employees to report smaller issues in order to prevent near incidents. | Percentage of submissions that are of the Near Miss type. | Yes |
|
Submissions Entered: Loss |
Lagging indicator | Most submissions should be observations and near misses. If employees are reporting a lot of losses instead of observations and near misses, then they are waiting too long to report issues or they are focusing only on major problems and not paying attention to the smaller issues that could lead to incidents. Train employees to report smaller issues in order to prevent near incidents. | Percentage of submissions that are of the With Loss type. | Yes |
|
Submissions Entered: Marked Urgent |
Leading indicator | This is the percentage of submissions that are considered urgent. If this number is high, take a closer look at these submissions and make sure employees are marking only appropriate issues as urgent. | Percentage of submissions in which the Urgent check box was selected. | Yes |
| Submissions Investigated: Near Miss | Leading indicator | To make sure you have the best incident prevention methods in place, you must investigate all near misses. Ideally, this metric would be close to 100%, showing you that your team is effectively following up on any near misses to ensure they don't occur again and don't result in future incidents. | Percentage of investigated submissions that were of the Near Miss type. The system considers that a submission has been investigated if one of the following is true: ·A task of the Investigation type has been assigned from the submission. ·A task of the Investigation type has been assigned from an event to which the submission is linked. | No |
| Submissions Investigated: Loss | Lagging indicator | To make sure you have the best incident prevention methods in place, you must investigate incidents that have already occurred and follow up accordingly. Ideally, this metric would be close to 100%, showing you that your team is effectively following up on any incidents with losses. | Percentage of investigated submissions that were of the With Loss type. The system considers that a submission has been investigated if one of the following is true: ·A task of the Investigation type has been assigned from the submission. ·A task of the Investigation type has been assigned from an event to which the submission is linked. | No |
| Hit Ratios: Observation: Injury | Leading indicator | Your goal is to increase the first number (number of observations), while reducing the second number in this ratio (number of injuries). | Ratio comparing the total number of submissions of the Observation type entered during the selected period with the total number of injuries recorded during the same time. | No |
| Hit Ratios: Near Miss : Injury | Leading indicator | Your goal is to increase the first number (number of near misses that were reported), while reducing the second number in this ratio (number of injuries). | Ratio comparing the total number of submissions of the Near Miss type entered during the selected period with the total number of injuries recorded during the same time. | No |