Time Efficiency Section
The Time Efficiency section helps you evaluate how quickly your Safety team responds to submissions. You can also use this section to evaluate how fast additional follow-up actions, such as corrective actions and supplementary training, are implemented.
Make sure you have set up clear expectations for how quickly submissions, events, and tasks should be completed. This section provides completion statistics for the first 48 hours after a record was created.
Drill-Down Details
- Click the Time Efficiency heading to open a drill-down report that displays the trend of each metric for the last 12 months.
| Metric | Type | Description | Calculation Method | Drill-Down |
|---|---|---|---|---|
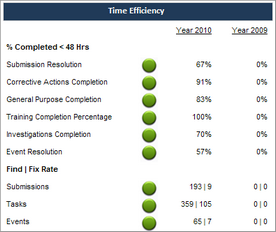
| Submission Resolution | Leading indicator | This is the percentage of submissions that were resolved in less than 48 hours during the selected time period. | Percentage of submissions submitted during this time period that were updated to a status of Resolved less than 48 hours after they were submitted. | No |
| Corrective Actions Completion | Leading indicator | This is the percentage of corrective actions that were resolved in less than 48 hours during the selected time period. | Percentage of tasks flagged as corrective actions that were updated to a status of Completed less than 48 hours after they were assigned. | No |
| General Purpose Completion | Leading indicator | This is the percentage of general follow-up tasks that were completed in less than 48 hours during the selected time period. | Percentage of tasks of the General Purpose type that were updated to a status of Completed less than 48 hours after they were assigned. | No |
| Training Completion Percentage | Leading indicator | This is the percentage of training-related tasks that were completed in less than 48 hours during the selected time period. | Percentage of tasks of the Assign Training type that were updated to a status of Completed less than 48 hours after they were assigned. | No |
| Investigations Completion | Leading indicator | This is the percentage of investigations that were completed in less than 48 hours during the selected time period. | Percentage of tasks of the Investigation type that were updated to a status of Completed less than 48 hours after they were assigned. | No |
| Event Resolution | Leading indicator | This is the percentage of events that were resolved in less than 48 hours during the selected time period. | Percentage of events that were updated to a status of Completed less than 48 hours after they were created. | No |
| Find | Fix Rate: Submissions | Leading indicator | This metric compares the total number of submissions that were recorded and how many of them were taken care of during the selected time period. | Comparison between the number of submissions submitted into the system during the selected time period (Find) and the number of submissions changed to a status of Resolved during the same period (Fix). | No |
| Find/Fix Rate: Tasks | Leading indicator | This metric compares the total number of tasks that were assigned and how many of them were taken care of during the selected time period. | Comparison between the number of tasks assigned during the selected time period (Find) and the number of tasks changed to a status of Completed during the same period (Fix). | No |
| Find/Fix Rate: Events | Leading indicator | This metric compares the total number of events that were created to follow up on issues and how many of them were completed during the selected time period. | Comparison between the number of events created during the selected time period (Find) and the number of events changed to a status of Resolved during the same period (Fix). | No |