Culture Indicators Section
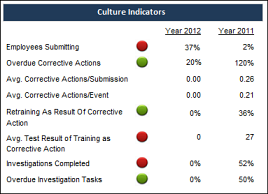
The Culture Indicators section helps you evaluate your company's overall safety culture. Are your employees taking the time to improve the safety of their own workplace? Are managers and Safety team members implementing corrective actions promptly? Are employees paying attention to their training, or do they need to be retrained frequently? This section provides the data you need to answer these questions and more.
Drill-Down Details
- Click the Culture Indicators heading to open a drill-down report that displays the trend of each metric for the last 12 months.
- Click some of the metrics to see drill-down reports that list all the records contributing to these totals. Refer to the Drill-Down column in the table below to see the metrics that allow you to drill down to more details.
| Metric | Type | Description | Calculation Method |
|---|---|---|---|
| Employees Submitting | Leading indicator | This is the percentage of
employees who are recording submissions. This number should be as close to 100%
as possible. Ideally, most of your employees would feel ownership over the
safety of their workplace and participate in improving it by actively
submitting issues they notice in their environment. Drill down to see the
employees who are submitting issues. ·If it is mostly supervisors and managers
who are submitting issues, then you need to better train your workers to ensure
they feel ownership over the submission process, too. ·If specific groups or
departments are reporting issues more than others, investigate and see why
other groups are not reporting any issues. It is just as important to look at
the employees who are submitting as at those who are not submitting. An
increase in this number would indicate an improvement from the previous period
and would display a green indicator
|
Percentage of employees who submitted at least one submission. |
| Overdue Corrective Actions | Lagging indicator | This is the percentage of
corrective actions that were not resolved on time. If this percentage is high,
then employees assigned to follow up on these tasks may not be taking their
assignments and their due dates seriously. Make sure you have set clear
expectations regarding due dates. A decrease in this number would indicate an
improvement from the previous period and would display a green indicator
|
Percentage of tasks flagged as corrective actions that have a past due date. |
| Avg. Corrective Actions/Submission | Lagging indicator | This is the average number of corrective actions that are implemented for each submission. Note: The report does not display an indicator for this metric. | Average number of corrective action tasks assigned for each submission submitted during the selected time period. |
| Avg. Corrective Actions/Event | Lagging indicator | This is the average number of corrective actions that are implemented for each event record created in IMS. Note: The report does not display an indicator for this metric. | Average number of corrective action tasks assigned for each event created during the selected time period. |
| Retraining as Result of Corrective Action | Lagging indicator | This is the number of corrective actions assigning training that employees have already completed. If this percentage is high, then you may need to evaluate the effectiveness of your training programs. Why do employees have to retake training they've already attended? Why do incidents occur that should be prevented by the training employees have taken? Are supervisors implementing recommendations from training as expected? | Percentage of tasks that meet all the criteria listed below: They are of the Assign Training type. They were flagged as corrective actions. The employees who are assigned this new training task have already taken this training in the past. |
| Avg. Test Result of Training as Corrective Action | Leading indicator | This is the average test score
obtained when employees are assigned training to follow up on a submission. If
this number is high, then you may want to evaluate the correlation between
training and your work environment. ·If training is effective, why doesn't it
help reduce the number of incidents? Does training clearly address real-life
scenarios and considerations? An increase in this number would indicate an
improvement from the previous period and would display a green indicator
|
Average score for all training assigned as a result of Assign Training-type tasks that were also flagged as corrective actions during the selected time period. |
| Investigations Completed | Leading indicator | This is the percentage of investigations that were completed during the selected time period. | Percentage of tasks of the Investigation type that were changed to a status of Completed. |
| Overdue Investigation Tasks | Leading indicator | This is the percentage of
investigations that were not completed on time. If this percentage is high,
then your team may not be taking due dates seriously. Make sure you have set
clear expectations regarding due dates for their investigations. A decrease in
this number would indicate an improvement from the previous period and would
display a green indicator
|
Percentage of tasks of the Investigation type that have a past due date. |