Loss Statistics Section
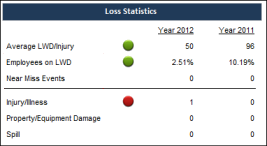
The Loss Statistics section provides details about the types of losses your organization has experienced as a result of recent incidents, for example, injured employees, lost work days (LWD), or property damages.
Drill-Down Details
- Click the Loss Statistics heading to open a drill-down report that displays the trend of each metric for the last 12 months.
- Click some of the metrics to see drill-down reports that list all the records contributing to these totals. Refer to the Drill-Down column in the table below to see the metrics that allow you to drill down to more details.
| Metric | Type | Description | Calculation Method | Drill-Down |
|---|---|---|---|---|
| Average LWD/Injury | Lagging indicator | This is the average number of days
that injured employees are off work due to their injuries. A decrease in this
number would indicate an improvement from the previous period and would display
a green indicator
|
Number of lost work days (LWD) recorded during the selected time period divided by number of injuries recorded during the same time. | No |
| Employees on LWD | Lagging indicator | This is the number of employees
that are out of work due to an incident during the selected time period. A
decrease in this number would indicate an improvement from the previous period
and would display a green indicator
|
Percentage of employees that accrued lost work days (LWD). Note: Each employee with LWD counts only once in this number even if the employee was on disability several different times during the selected time period. | Yes |
| Injury Events | Lagging indicator | This is the number of incidents that resulted in at least one injury. | Number of events created during the selected time period that are associated with an injury. Note: If a single event is associated with an injury, spill, and property damage, then it is counted in each of these categories in this section. | Yes |
| Spill Events | Lagging indicator | This is the number of incidents that resulted in at least one spill. | Number of events of the With Loss type created during the selected time period in which the Spill check box has been selected. Note: If a single event is associated with an injury, spill, and property damage, then it is counted in each of these categories in this section. | Yes |
| Property Loss Events | Lagging indicator | This is the number of incidents that resulted in damage to at least one piece of equipment, a building, or other element of your company's property. | Number of events of the With Loss type created during the selected time period in which the Property/Equipment Damage check box has been selected. Note: If a single event is associated with an injury, spill, and property damage, then it is counted in each of these categories in this section. | Yes |
| Near Miss Events | Leading indicator | This is the number of near misses that your team researched using event records in IMS. | Number of events of the Near Miss type created during the selected time period. | Yes |