Observation Counts
This report shows the number of observation-type incidents submitted per location or classification. Use this report to see how many observation-type incidents your company has had this month compared to previous months or how many observations your location has had this year compared to last year, for example. The report groups incidents by either classification or incident location, based on your selections. Anonymous submissions are included in the observation count.
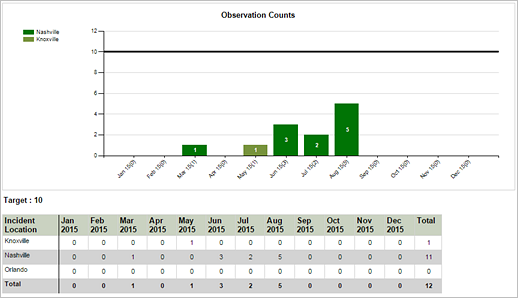
The bar chart provides a graphical representation of the total observation counts per location or classification for the entire selected date range. This count displays in the last column of the grid.
The grid shows the number of observations per location or classification that are included in the report. Configure the grid to display counts by month, quarter or year based on your selection in the Subtotals parameter.
Observations that do not include a location display in the column, No Location, when grouping by incident location.
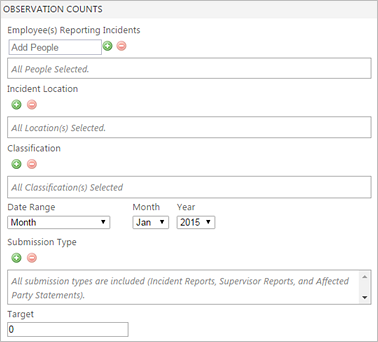
Report parameters
| Parameter | Default Value | Details |
|---|---|---|
|
Employee(s) Reporting Incidents |
None selected |
|
|
Incident Location |
None selected |
All locations are included by default. |
|
Classification |
None selected |
All classifications are included by default. |
|
Date Range |
Month |
Select one of the following options in this parameter:
|
|
Submission Type |
All |
Select Incident Report, Supervisor Report, and/or Affected Party Statement. |
|
Target |
None |
The Target parameter is a free-text value that allows a whole numberic value. The Target line does not appear if no value is provided. 2,147,483,647 is the default maximum positive value for this parameter. Note:
Labels on the bar chart may not be readable when the target value is higher than the number of observations submitted by a location because the graph's scale changes to include the target. To display labels clearly on the bar chart, change the target value if the target is higher than the number of observations. If you do not want to change the target value, view the total number of submissions in the the grid. |