Event Counts
This report shows the number of observations per location or classification. Use this report to see how many events your company has had this month compared to previous months or how many events your location has had this year compared to last year, for example. The report groups events by either classification or incident location, based on your selections.
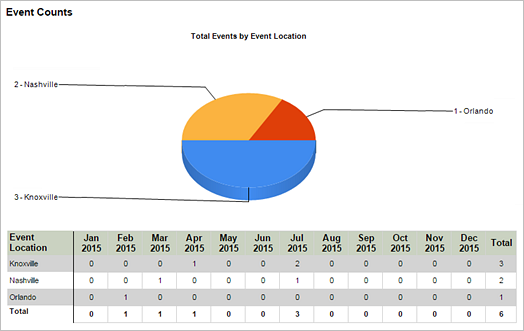
The pie chart provides a graphical representation of the total events grouped by classification or event location. This count also displays in the last column of the grid.
The grid shows the number of events per location or classification. Configure the grid to display counts by month, quarter or year based on your selection in the Subtotals parameter.
All events are included on the report, for example, events without a location. Events that do not include a location display with No Location when grouping by incident location.
Reports parameters
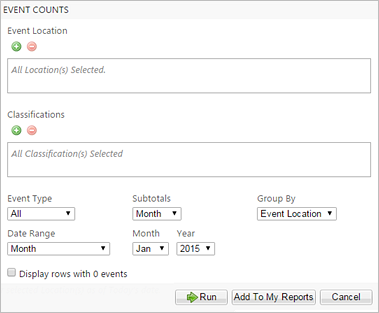
| Parameter | Default Value | Details |
|---|---|---|
|
Event Location |
None selected |
All locations are included by default. |
|
Classifications |
None selected |
All classifications are included by default. |
|
Event Type |
All |
You can select observation, near miss, with loss, or all. |
|
Subtotals |
Month |
You can select to display subtotals by year, quarter, or month. |
|
Group By |
Incident Location |
You can select to group the list by incident classification or the location of the incident. A single event is counted multiple times when grouping by classification if the event includes multiple classifications. This happens if the default value is used or if both classifications are selected. For example, if an event has both injury and illness classifications, and both are selected in the Classifications parameter, the event will appear twice on the report. |
|
Date Range |
Month |
You can select the following options in this parameter:
Note: Only submissions that are included in the selected date
range appear in the report. For example, if the selected date range includes part
of a month, only submissions for that part of the month appear.
|
| Display rows with 0 count | Unchecked | When checked, rows without submissions display on the report. |