Submission Metrics
This section displays four graphs of submission and observation counts. Use these graphs to compare submissions with specific classifications and incident types.
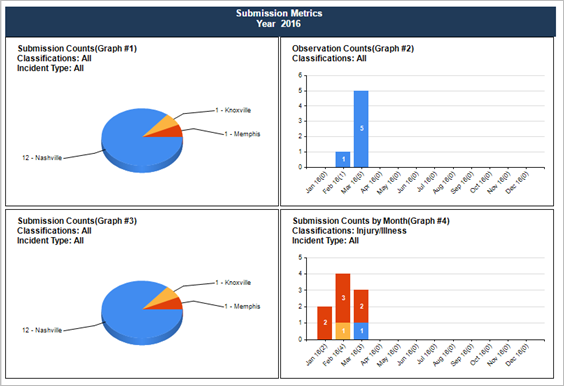
- Submission Counts (Graph #1 and
Graph #3). Each displays a pie chart with submissions that meet the selected
parameters in the selected date range, grouped by location.
Drill-down to the Submissions Entered report to view the location where the submission was reported.
Use these graphs to compare submissions with different classifications (Injury/Illness vs. Property/Equipment Damage) or submissions of different incident types (With Loss vs. Near Miss). For example, select Near Miss in the Incident Types parameter in Graph #1 and select With Loss in the Incident Types parameter in Graph #3 to compare the number and location of submissions of each type.
- Observation Counts (Graph #2).
Displays a bar graph with observations that meet the selected parameters in the selected
date range, grouped by month. This graph includes only observation-type submissions. A
target trend line appears when you type an observation target. Use this line to visually
compare your observation counts to your observation target goals.
Drill-down to the Observation Counts report to view the location where each observation was reported.
- Submission Counts (Graph #4):
Displays a bar graph with submissions that meet the selected parameters in the selected
date range, grouped by month.
Drill-down to the Submission Entered report to view the location where each submission was reported.
Use this graph to compare the observation counts in Graph #2 to near misses and/or with loss type submissions.
The location(s) and date range selected in the Overall Metrics section apply to these graphs.
Section parameters
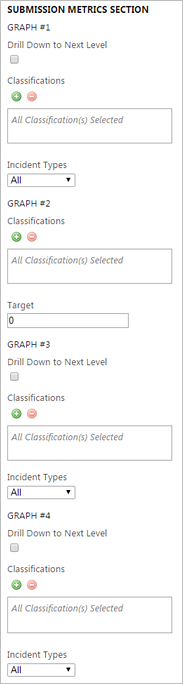
Submission Counts: Graph #1
| Parameter | Default Value | Details |
|---|---|---|
| Drill Down to Next Level | Selected |
When selected, the report displays the child locations of the location selected in the Overall Metrics Location parameter. A No Data is Available message appears if no child locations are available. When cleared, the report shows only the location selected in the Overall Metrics Location parameter. |
| Classifications | None selected | |
| Incident Types | All |
Observation Counts: Graph #2
| Parameter | Default Value | Details |
|---|---|---|
| Classifications | None selected | |
| Target | 0 | Type the observation target for your organization. The target line appears on the graph. |
Submission Counts: Graph #3
| Parameter | Default Value | Details |
|---|---|---|
| Drill Down to Next Level | Selected |
When selected, the report displays the child locations of the location selected in the Overall Metrics Location parameter. A No Data is Available message appears if no child locations are available. When cleared, the report shows only the location selected in the Overall Metrics Location parameter. |
| Classifications | None selected | |
| Incident Types | All |
Submission Counts by Month: Graph #4
| Parameter | Default Value | Details |
|---|---|---|
| Drill Down to Next Level | Selected |
When selected, the report displays the child locations of the location selected in the Overall Metrics Location parameter. A No Data is Available message appears if no child locations are available. When cleared, the report shows only the location selected in the Overall Metrics Location parameter. |
| Classifications | None selected | |
| Incident Types | All |