TRIR Comparison
This section displays a comparison of your location's overall TRIR for the selected date ranges. A second graph displays the monthly TRIR rate for each of the selected date ranges. For example, compare your location's overall and monthly TRIR for January through March for multiple years.
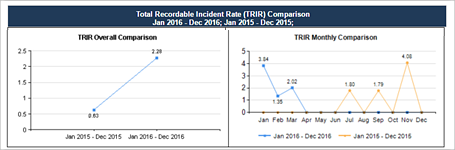
This section of the report displays two graphs:
- TRIR Overall Comparison. Displays
a line that charts the overall TRIR for each selected date range.
The values on the graph are a single calculation of the TRIR for each date range selected.
- TRIR Monthly. Displays a trend
line that charts the monthly TRIR for each selected date range.
The values on the graph are the monthly TRIR calculations for each month for each date range selected. Up to 5 trend lines appear on this graph.
The TRIR calculations use the monthly hours worked information that is entered for each location through import or by manual data entry.
Section parameters
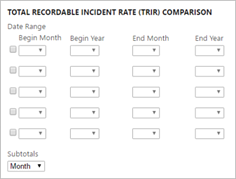
| Parameter | Default Value | Details |
|---|---|---|
| TRIR Comparison Date Range | Select up to five date ranges. Date ranges must be shorter than 12 months. For example, you can select July 2011 to June 2012, but you cannot select July 2011 to June 2015. This parameter applies to both graphs. |
|
| Subtotals | Month | Select to group results by month or quarter. This field is required. |