TRIR: Rolling Rate
This section displays a trend line for the monthly rolling rate and a bar graph for each monthly rate. Run this report for up to 24 months (2 years). The grid beneath the graph contains details about the rolling rate and monthly rates. Use this section to compare the rolling rate to monthly TRIR.
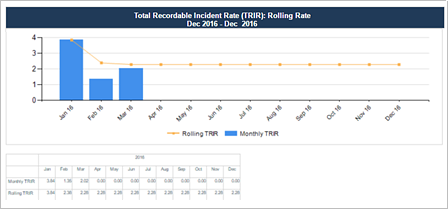
- Rolling TRIR: Trend line shows the rolling TRIR for your primary location. See the Rolling Rate calculation below.
- Monthly TRIR: Bar graphs shows the TRIR for each month for your primary location.
Section parameters

The rolling rate calculations use the monthly hours worked information that is entered for each location through import or by manual data entry.
The TRIR Rolling Rate graphs display rolling rates through the last full month.
| Parameter | Default Value | Details |
|---|---|---|
| Number of Months | 1 |
Select up to 24 months. The report shows the rate starting with the first month of the Date Range selected in the Overall Metrics section. For example, April 2014 is the first month to appear in the graph if Quarter 1 2015 is selected. |
Calculation of rolling rate
The rolling rate uses all the hours worked from the beginning of the report date range through each month. The monthly rate takes into account only the hours worked for that month.
The rolling rate uses a standard calculation of A x 200,000 / B.
|
A = |
the number of recordable injuries and fatalities with an injury date in each month + the number of recordable injuries and fatalities for the months between the start of the date range and the current month Example: Scenario: Running the report for 3 months (July to September 2014) The rolling incidence rate for July uses the number of recordable injuries with an injury date in July (A), same as the monthly calculation for July. The rolling incidence rate for August uses the number of recordable injuries with an injury date in July and August (A). The rolling incidence rate for September uses the number of recordable injuries with an injury date in July, August, and September. |
|
B = |
the number of hours worked for the month + the hours worked for the months between the start of the date range and the current month Example: Scenario: Running the report for 3 months (July to September 2014) The rolling incidence rate for September uses the total number of hours worked (B) for July, August, and September. |